The Mystery of Eureka Health Monitoring
A story about the mysteries of Netflix Eureka health monitoring
Even though I’m fairly experienced with designing and configuring systems with health monitoring, when I first started configuring Eureka health-checks, I had to put some considerable effort to find out answers to a few why and when questions. This post is to complement the Spring Cloud Netflix Eureka documentation on Health Checks with my findings.
To begin with, let’s look at the description of one of the configurations from the documentation.
eureka.instance.health-check-url
Gets the absolute health check page URL for this instance. The users can provide the healthCheckUrlPath if the health check page resides in the same instance talking to eureka, else in the cases where the instance is a proxy for some other server, users can provide the full URL. If the full URL is provided it takes precedence.
If it’s hard to comprehend, read on.
Learnt or Taught Monitoring?
Health checks are performed in order to identify and evict unhealthy (i.e. down, unreachable) microservices from the Eureka server registry. However, Eureka servers never send keep-alive requests to their registered clients (as opposed to some Traffic Managers), instead, Eureka clients send heartbeats to Eureka servers.
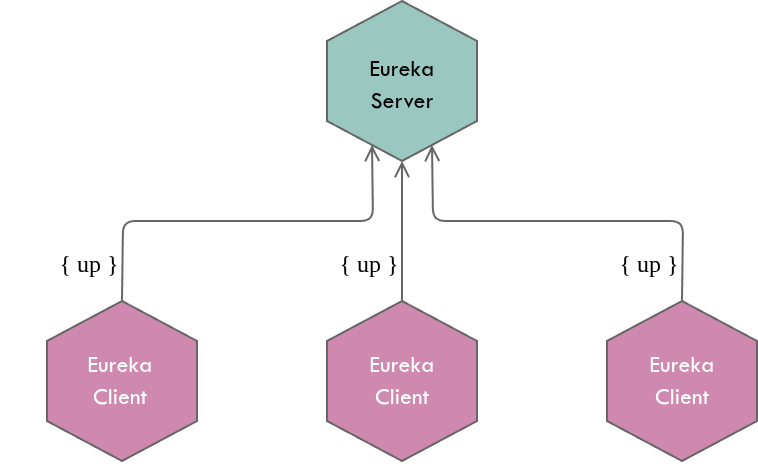
On a side note, I would like to coin the term Learnt Monitoring for the approach where servers send keep-alive requests to clients in order to learn whether they are healthy; and the term Taught Monitoring for the approach where clients send heartbeats to servers in order to educate the server on their health status.
Taught monitoring is OK for microservices since it’s not much of a burden to embed a client (i.e. Eureka client) who knows how to send heartbeats to a configured set of servers. Also it’s obvious that the clients themselves have to determine their health status and Eureka server has to expose some REST operations for clients to publish their heartbeats.
Eureka server ReST operations
Eureka server exposes the following resource to which the clients send heartbeats.
PUT /eureka/apps/{app-id}/{instance-id}?status={status}
I’ve omitted few other query parameters for clarity. {instance-id} takes the form of hostname:app-id:port where it identifies a unique Eureka client instance. Eureka server recognizes a few statuses - UP, DOWN, STARTING, OUT_OF_SERVICE and UNKNOWN.
i.e. once values assigned;
PUT /eureka/apps/ORDER-SERVICE/localhost:order-service:8886?status=UP
Upon receiving a heartbeat request from a client instance, Eureka server renews the lease of that instance. If it’s the very first heartbeat from a given client, Eureka server responds with a 404 and right after that the client will send a registration request.
Furthermore, Eureka server exposes the following operations to allow overriding and undo-overriding the health status.
PUT    /eureka/apps/{app-id}/{instance-id}/status?value={status}
DELETE /eureka/apps/{app-id}/{instance-id}/status
The overriding operation (i.e. the PUT operation above) is used to take otherwise a healthy instance OUT_OF_SERVICE manually or by administration tools such as Asgard, in order to temporarily disallow traffic to some instance. i.e.
PUT /eureka/apps/ORDER-SERVICE/localhost:order-service:8886/status?value=OUT_OF_SERVICE
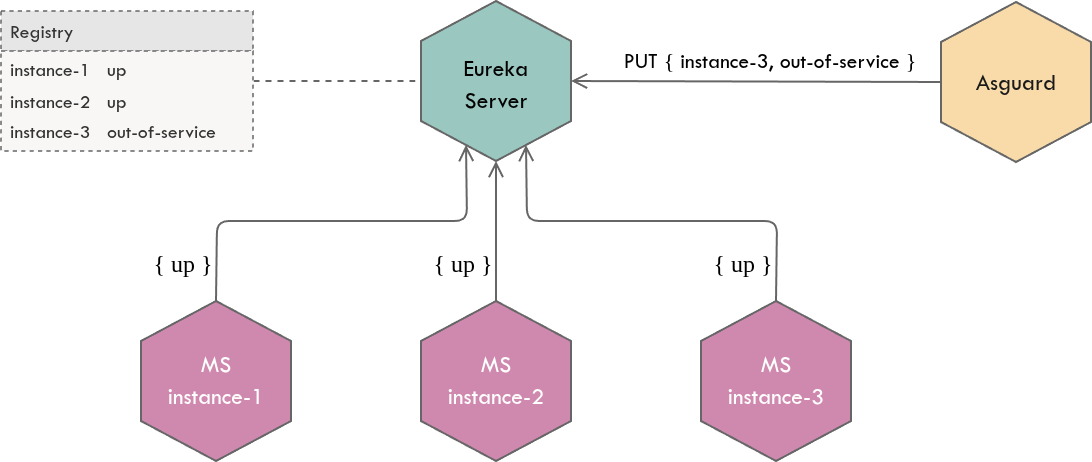
This will be useful for red black deployments where you run older and newer versions of a microservice for some period of time (in order to easily rollback to older version if the new version is unstable). Once the deployment of the new version is completed and the new version has started serving requests, instances of the older version can be taken OUT_OF_SERVICE (without bringing them down) so that they will just stop serving requests.
The above overridden status of an instance, OUT_OF_SERVICE in this case, can also be discarded and we can instruct Eureka server to start honoring the status as published by the instance itself as follows.
DELETE /eureka/apps/ORDER-SERVICE/localhost:order-service:8886/status
This will be useful when you find the new version of a microservice is unstable and you want to get the older version (i.e. which is already in OUT_OF_SERVICE) to start serving requests.
Eureka client self-diagnosis
Eureka clients (or servers) never invoke the /health endpoint to determine the health status of an instance. Health status of a Eureka instance is determined by a HealthCheckHandler implementation. The default HealthCheckHandler always announces that the application is in UP state as long as the application is running.
Eureka allows custom HealthCheckHandlers to be plugged-in through the EurekaClient#registerHealthCheck() API. Spring Cloud leverages this extension point to register a new handler, EurekaHealthCheckHandler, if the following property is set.
eureka.client.healthcheck.enabled=true
The EurekaHealthCheckHandler works by aggregating health status from multiple health indicators such as;
- DiskSpaceHealthIndicator
- RefreshScopeHealthIndicator
- HystrixHealthIndicator
and mapping the aggregated status into one of Eureka supported statuses. This status will then be propagated to Eureka server through heartbeats.
Eureka client health endpoints
Eureka clients POST a healthCheckUrl in the payload when they are registering themselves with the server. The value of the healthCheckUrl is calculated from the following instance properties.
eureka.instance.health-check-url=...
eureka.instance.health-check-url-path=...
The default value of the health-check-url-path is /health which is the spring-boot’s default health actuator endpoint that will be ignored if a health-check-url property is set. Ideally you should configure these properties if you implement a custom health endpoint or change the properties impacting the default health endpoint path. i.e.
- If you change the default health endpoint path
endpoints.health.path=/new-health
# configure either a relative path
eureka.instance.health-check-url-path=${endpoints.health.path}
# or an absolute path
eureka.instance.health-check-url=http://${eureka.hostname}:${server.port}/${endpoints.health.path}
- If you introduce a
management.context-path
management.context-path=/admin
# configure either a relative path
eureka.instance.health-check-url-path=${management.context-path}/health
# or an absolute path
eureka.instance.health-check-url=http://${eureka.hostname}:${server.port}/${management.context-path}/health
Making use of health status
Eureka servers do not care much about what a client’s status is - except it just records it. When somebody queries its registry with the following API, it will publish the client’s health status as well, along with many other information.
GET /eureka/apps/ORDER-SERVICE
<application>
  <name>ORDER-SERVICE</name>
  <instance>
    <instanceId>localhost:order-service:8886</instanceId>
    <ipAddr>192.168.1.6</ipAddr>
    <port>8886</port>
    <status>UP</status>
    <overriddenstatus>UP</overriddenstatus>
    <healthCheckUrl>http://localhost:8886/health</healthCheckUrl>
    ...
    ...
  </instance>
</application>
The response has three important health related information - status, overriddenstatus and healthCheckUrl.
statusis the health status as published by the Eureka instance itself.overriddenstatusis the enforced health status manually or by tools. ThePUT /eureka/apps/{app-id}/{instance-id}/status?value={status}operation is used to override the status published by Eureka instance and once invoked bothstatuswill also be changed to theoverriddenstatus.healthCheckUrlis the endpoint which the client exposes toGETits health status
This information can be leveraged by tools for various purposes.
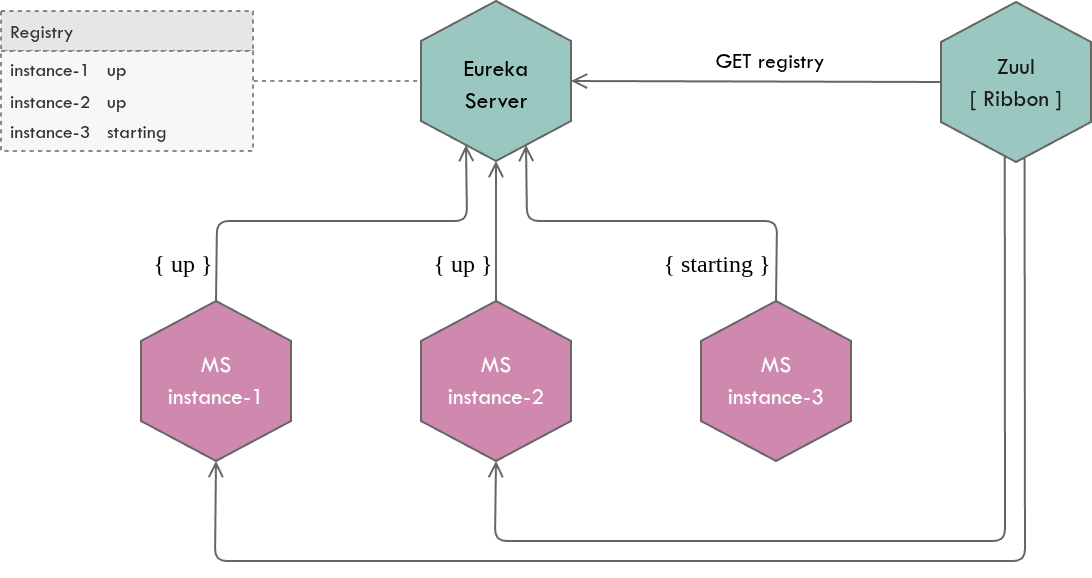
- Client-side load balancers like Ribbon to make load balancing decisions
Ribbon reads thestatusattribute and considers only the instances withUPstatus for load balancing. Ribbon however does not invoke thehealthCheckUrlbut relies on published instance status available in the registry.
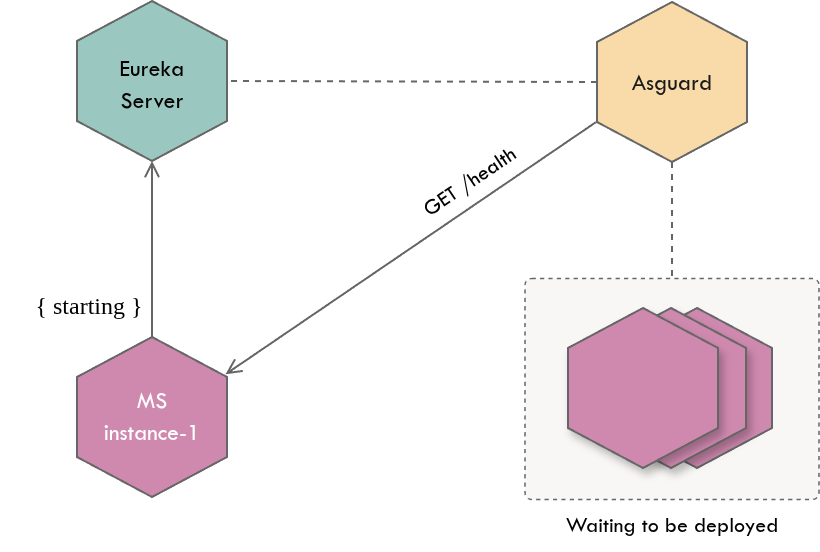
- Deployment tools like Asgard to make deployment decisions
During rolling deployments, Asgard first deploys one instance of the new version of a microservice and waits till that instance is transitioned toUPstatus - before deploying rest of the instances (as a risk mitigation strategy). However, rather than relying on instance status available in the Eureka server registry (i.e. thestatusattribute), Asgard learns instance status by invoking itshealthCheckUrl. It could be because the value ofstatusattribute can be stale (since it’s dependent on a few factors as described in the next section) but live healthstatusis important in this case in order to avoid deployment delays.
Accuracy of health status
The Eureka server registry (hence the health status) is not always accurate due to the following reasons.
-
AP in CAP
Eureka being a highly available system in terms of CAP theorem, information in the registry may not be consistent between Eureka servers in the cluster - during a network partition. -
Server response cache
Eureka servers maintain a response cache which is updated in every 30 seconds by default. Therefore an instance which is actuallyDOWNmay appear to beUPin theGET /eureka/apps/{app-id}/response. -
Scheduled heartbeats
Since the Eureka clients send heartbeats in every 30 seconds by default, health status changes in between the heartbeats are not reflected in the Eureka server registry. -
Self preservation
Eureka servers stop expiring clients from the registry when they do not receive heartbeats beyond a certain threshold which in turn makes the registry inaccurate.
Therefore the clients should follow proper failover mechanisms to complement this inaccuracy.